
Published March 16, 2020
5 Simple Graphs Proving This Is NOT Like the Last Time


With all of the volatility in the stock market and uncertainty about the Coronavirus (COVID-19), some are concerned we may be headed for another housing crash like the one we experienced from 2006-2008. The feeling is understandable. We do expect the US economy to enter a recession Q2 and into Q3 2020, but the impact on residential real estate should be mild. We don’t expect the recent market disruption to have a severe impact on home values or the residential real estate market here in Arizona. How long the recession will last depends heavily on the duration and severity of the Corona virus.
Industries that will feel the greatest impact are as followed:
- Hotels & vacation rentals
- Transportation - especially airlines
- Cruise operators
- Restaurants
- All tourism-related jobs
- Sports
- Entertainment
- Physical retail
- Retail landlords
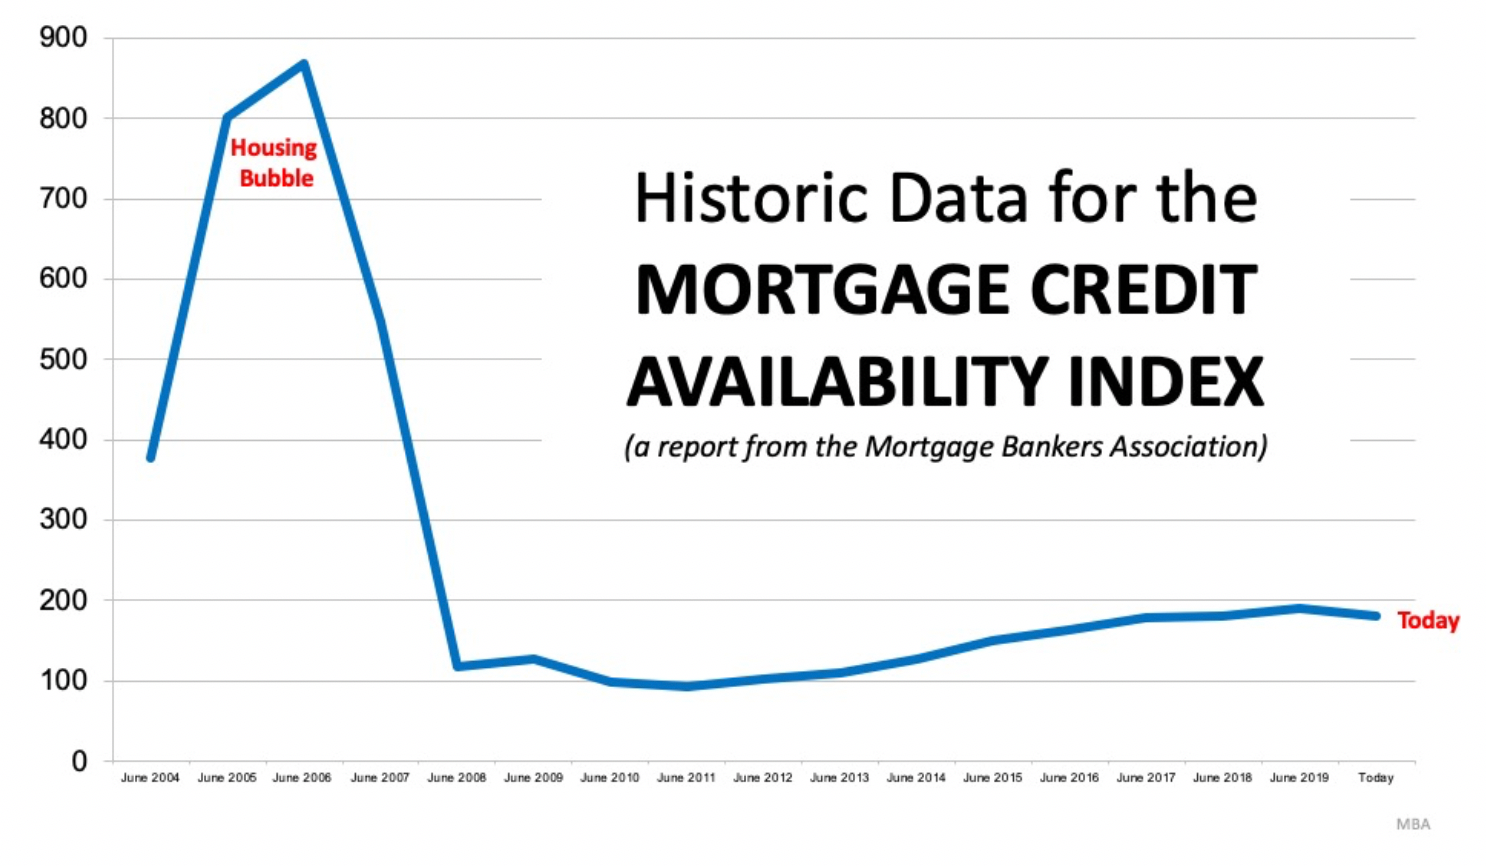
During the housing bubble, it was difficult NOT to get a mortgage. Today, it is tough to qualify. The Mortgage Bankers’ Association releases a Mortgage Credit Availability Index which is “a summary measure which indicates the availability of mortgage credit at a point in time.” The higher the index, the easier it is to get a mortgage. As shown below, during the housing bubble, the index skyrocketed. Currently, the index shows how getting a mortgage is even more difficult than it was before the bubble.
2. Prices are not soaring out of control.
Below is a graph showing annual house appreciation over the past six years, compared to the six years leading up to the height of the housing bubble. Though price appreciation has been quite strong recently, it is nowhere near the rise in prices that preceded the crash.
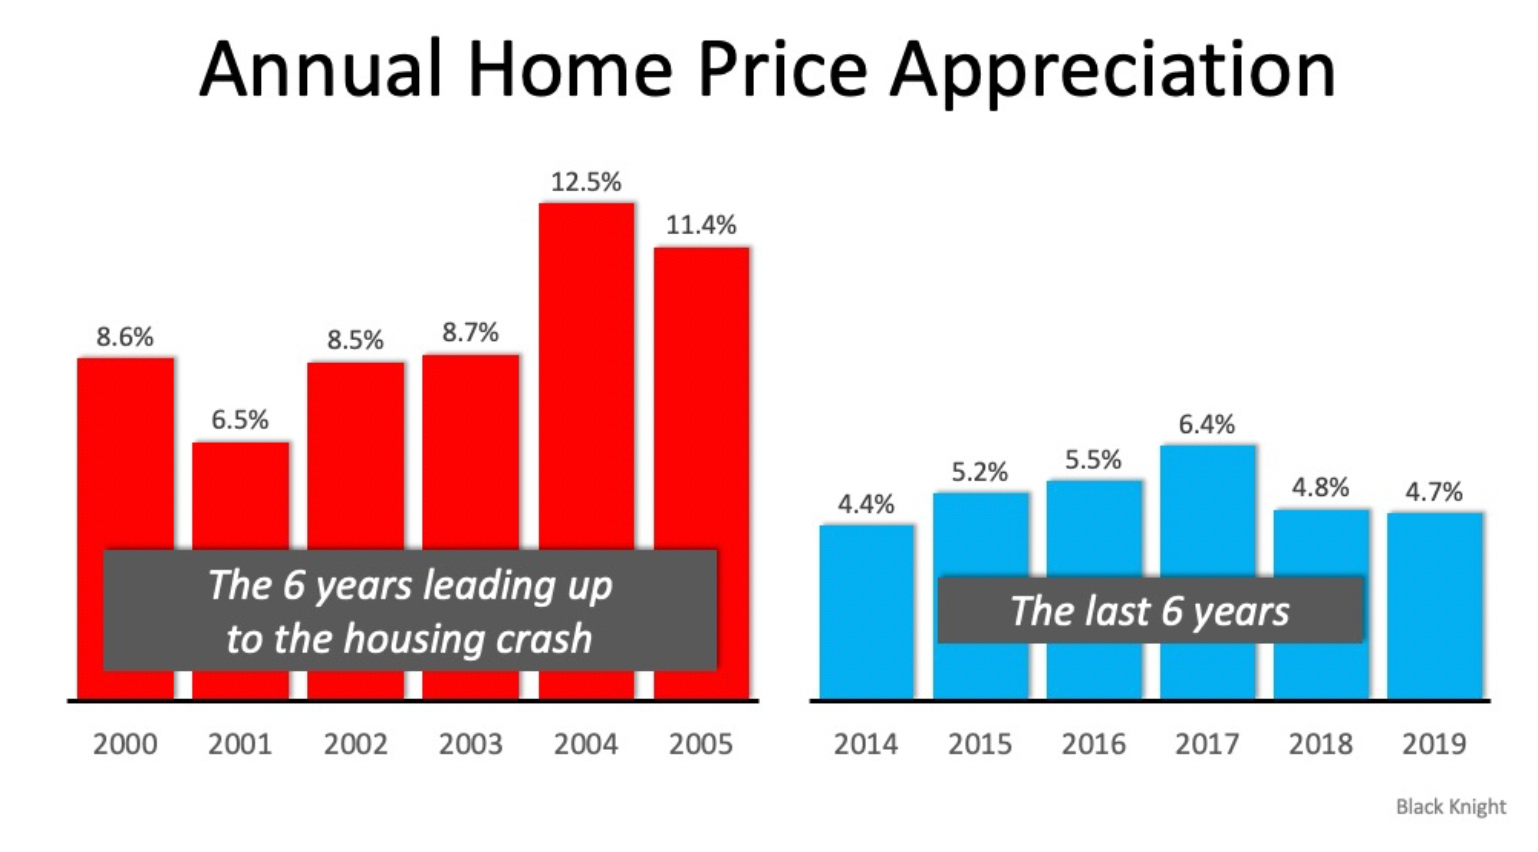
There’s a stark difference between these two periods of time. Normal appreciation is 3.6%, so while current appreciation is higher than the historic norm, it’s certainly not accelerating beyond control as it did in the early 2000s.
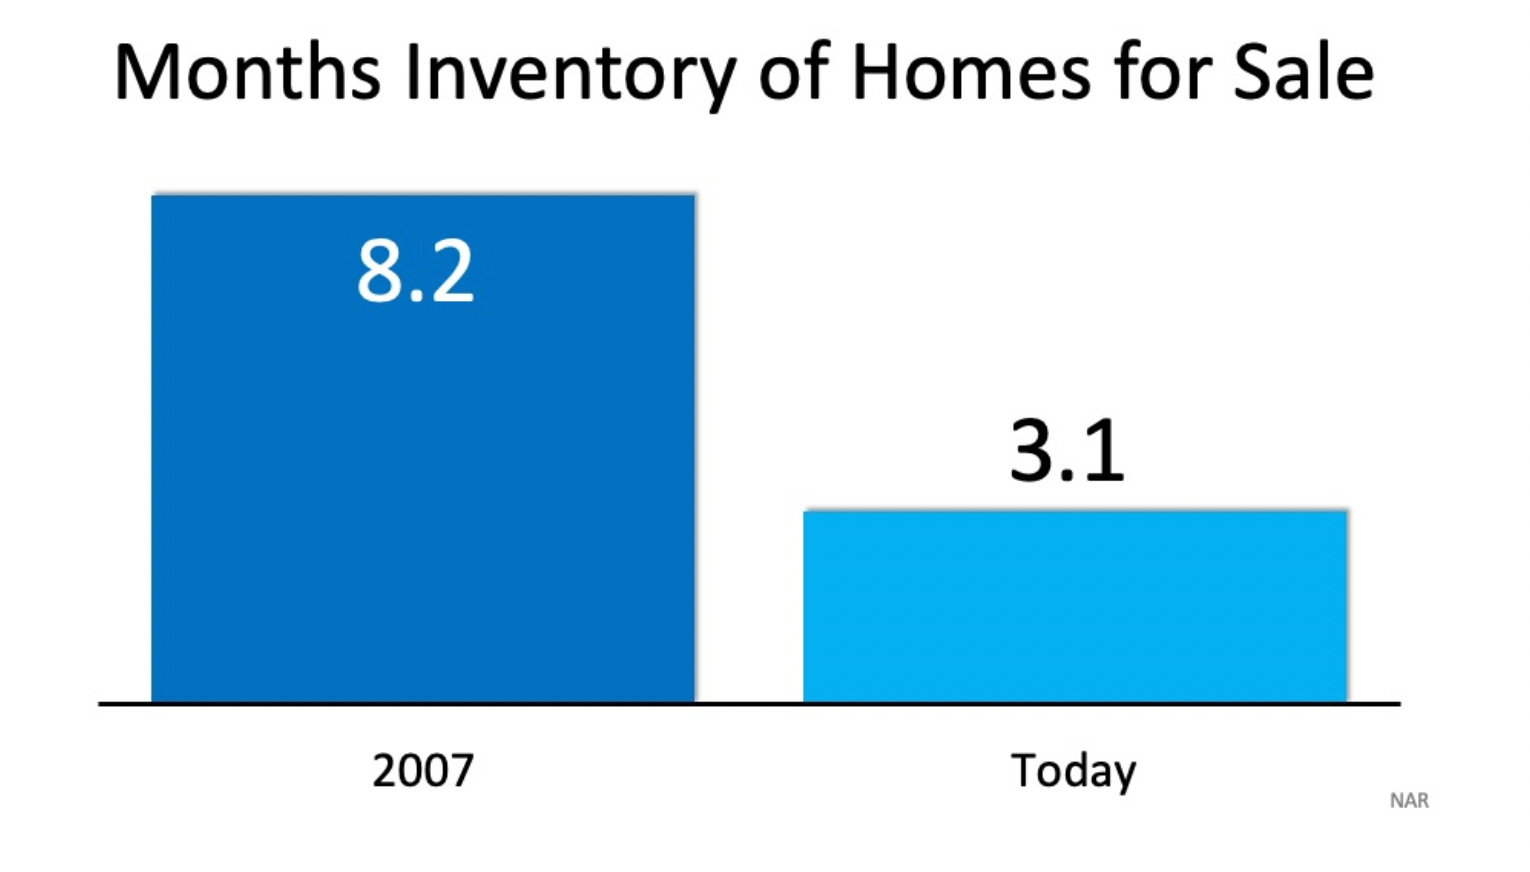
3. We don’t have a surplus of homes on the market. We have a shortage.
The months’ supply of inventory needed to sustain a normal real estate market is approximately six months. Anything more than that is an overabundance and will causes prices to depreciate. Anything less than that is a shortage and will lead to continued appreciation. As the next graph shows, there were too many homes for sale in 2007, and that caused prices to tumble. Today, there’s a shortage of inventory which is causing an acceleration in home values. Nation wide, months of supply is hovering around 3.1, but in Phoenix we are currently have 2 months of supply.
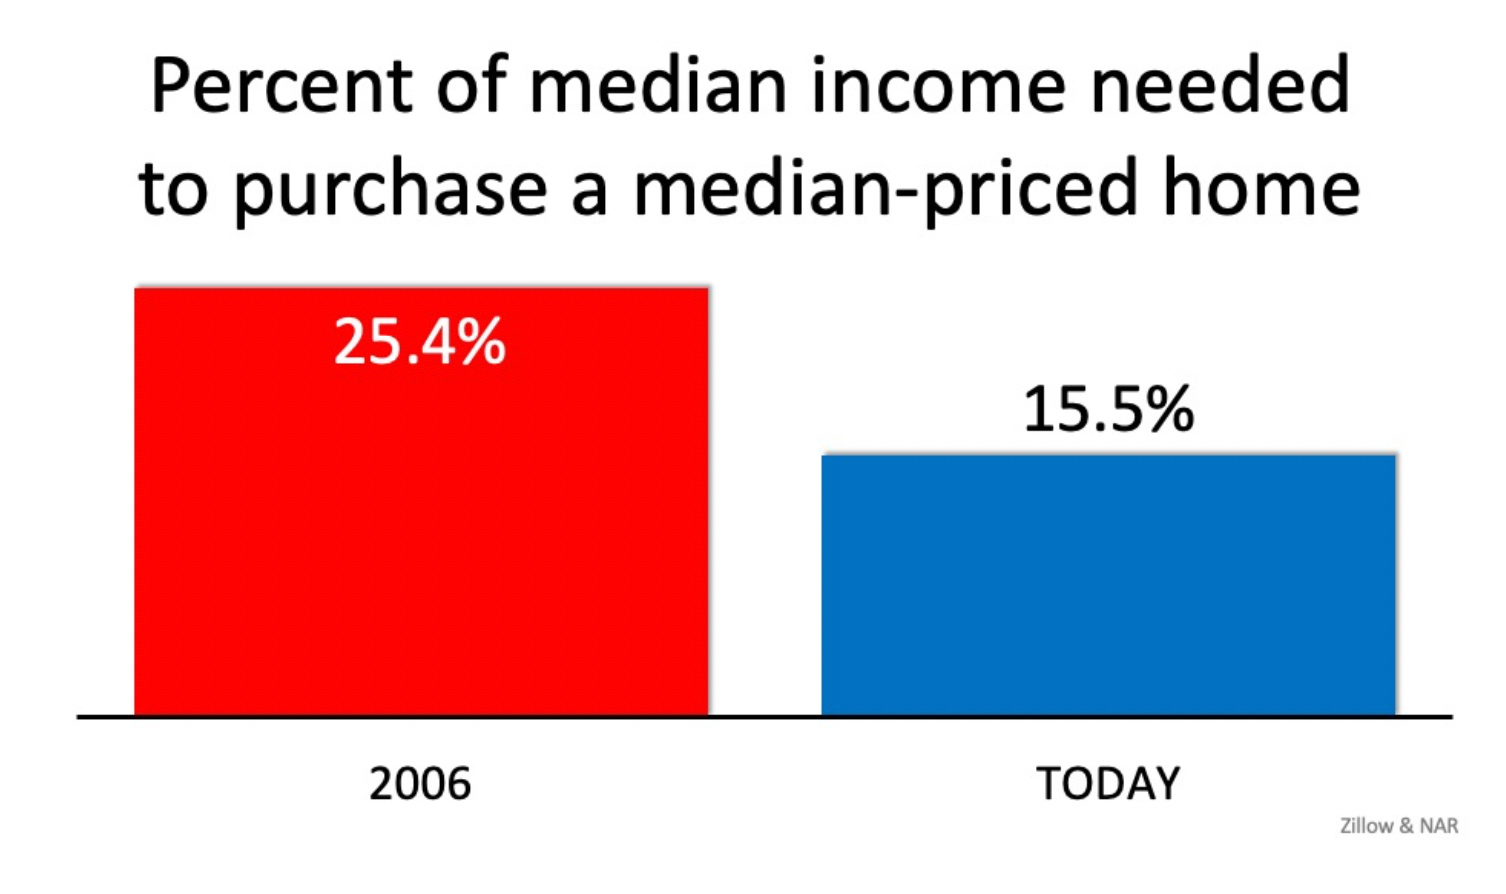
4. Houses became too expensive to buy.
The affordability formula has three components: the price of the home, the wages earned by the purchaser, and the mortgage rate available at the time. Fourteen years ago, prices were high, wages were low, and mortgage rates were over 6%. Today, prices are still high. Wages, however, have increased and the mortgage rate is about 3.5%. That means the average family pays less of their monthly income toward their mortgage payment than they did back then. Here’s a graph showing that difference:
5. People are equity rich, not tapped out.
In the run-up to the housing bubble, homeowners were using their homes as a personal ATM machine. Many immediately withdrew their equity once it built up, and they learned their lesson in the process. Prices have risen nicely over the last few years, leading to over fifty percent of homes in the country having greater than 50% equity. But owners have not been tapping into it like the last time. Here is a table comparing the equity withdrawal over the last three years compared to 2005, 2006, and 2007. Homeowners have cashed out over $500 billion dollars less than before.
.png)
During the crash, home values began to fall, and sellers found themselves in a negative equity situation (where the amount of the mortgage they owned was greater than the value of their home). Some decided to walk away from their homes, and that led to a rash of distressed property listings (foreclosures and short sales), which sold at huge discounts, thus lowering the value of other homes in the area. That can’t happen today.
What we’re likely to see in the short run:
- Investors will probably lose some enthusiasm for additional purchases
- Other buyers may defer or cancel buying decisions due to fear of losing their jobs
- Extremely low mortgage rates may compensate somewhat for the slowdown in demand
- Sellers may be less willing to allow strangers to view their home for fear they may be carrying the virus
- New home builders may experience shortages of supplies and build times may extend, reducing total supply
- People who are self-isolating, in quarantine or simply sent home by their employer are far less likely to go house hunting, or to list their home for sale
Bottom Line
If you’re concerned we’re making the same mistakes that led to the housing crash, take a look at the charts and graphs above to help alleviate your fears. We do expect the housing market to soften to some extent, but with only 2 months of supply, we have a sizable built in buffer before we reach equilibrium between buyers and sellers.
Investors equity is showing signs of slowing, meaning fewer institutional investors are buying residential real estate, a good thing in our opinion. Demand may wane, but we also expect some sellers to enter a holding pattern on listing their home for sale. If we do see this occur, supply and demand will be moving in tandem, resulting in fewer annual transactions, but not a significant change in home values.
Before the hysteria that is COVID-19, the market fundamentals were solid. Un-employment numbers were healthy. S&P 500 P/E ratios were healthy. Consumer sentiment also good. The sooner the market volatility subsides, the sooner our economy will be back on track. The FED is aggressively engaged in loosening monetary policy to stabilize the markets in an attempt to stave off larger losses. As a country, we’ve faced much larger threats to stability than Covid-19. We WILL get through this and be stronger for it.


